|
Peremennye Zvezdy (Variable Stars) 46, No. 4, 2026 Received 3 July; accepted 1 September. |
Article in PDF |
|
DOI: 10.24412/2221-0474-46-41-48
|
GSC 3989 1185 and HD142898 – New Multi-mode Low Amplitude δ Scuti Variables
Igor M. Volkov, Alexandra S. Volkova
Sternberg Astronomical Institute, Moscow University, Universitetsky Ave., 13, 119992 Moscow, Russia
A test for physical variability of stars in the
immediate vicinity of two eclipsing stars showed that HD 142989,
the reference star for BD -20 4369, and GSC 3989 1185, a close
neighbor of V340 Lac, are low-amplitude δ Scuti variables.
The first of them exhibits six pulsation modes and the second of
them, two pulsation modes. 4369, and GSC 3989 1185, a close
neighbor of V340 Lac, are low-amplitude δ Scuti variables.
The first of them exhibits six pulsation modes and the second of
them, two pulsation modes.
|
1. Introduction
Our observational program is primarily aimed at studying the internal structure of stars by measuring apsidal rotation velocities in eclipsing systems with elliptical orbits (Volkov & Volkova 2009; Volkov 2024). The program's success requires photometric measurements of the highest precision. Therefore, our ground-based measurements need careful selection of comparison stars to eliminate any additional errors that might be introduced by their physical variability. As a result and a by-product, we discover a large number of unknown low-amplitude variables.
2. Two-color diagram for δ Scuti stars
Some assistance in identifying potential pulsating stars is
provided by the fact that we conduct our measurements in all
 bands of the Johnson-Cousins broad-band photometric
system. In particular,
bands of the Johnson-Cousins broad-band photometric
system. In particular,  Scuti stars occupy a fairly narrow
region in the two-color diagrams, which prompts a more thorough
examination of their variability, since pulsations often occur in
multiple modes, beats can be observed, and, on some observing
nights, the star shows no variations, but if the star's color
indices are close to those of Scuti variables (type DSCT
according to Samus et al. 2017), observations continue. The
unreddened color indices of the DSCT stars fall within the
interval
Scuti stars occupy a fairly narrow
region in the two-color diagrams, which prompts a more thorough
examination of their variability, since pulsations often occur in
multiple modes, beats can be observed, and, on some observing
nights, the star shows no variations, but if the star's color
indices are close to those of Scuti variables (type DSCT
according to Samus et al. 2017), observations continue. The
unreddened color indices of the DSCT stars fall within the
interval
 , or 7550 K
  7100 K
according to the calibration from Flower (1996). In the present
study, we concentrate our attention on the regions occupied by
pulsating stars in the
7100 K
according to the calibration from Flower (1996). In the present
study, we concentrate our attention on the regions occupied by
pulsating stars in the 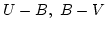 diagram, with the interstellar
absorption taken into account (see Fig. 1). The figure also shows
some DSCT type variables found by us, plotted as crosses: the
primary components of the eclipsing binaries V961 Cep (Volkov et
al. 2010), V577 Oph (Volkov 1990; Volkov & Volkova 2010),
V501 Mon (Volkova & Volkov, 2025). The prototype of DSCT stars,
Sct, is also shown in the diagram. All stars in this
diagram, with the exception of Sct, are subject to
significant interstellar extinction.
diagram, with the interstellar
absorption taken into account (see Fig. 1). The figure also shows
some DSCT type variables found by us, plotted as crosses: the
primary components of the eclipsing binaries V961 Cep (Volkov et
al. 2010), V577 Oph (Volkov 1990; Volkov & Volkova 2010),
V501 Mon (Volkova & Volkov, 2025). The prototype of DSCT stars,
Sct, is also shown in the diagram. All stars in this
diagram, with the exception of Sct, are subject to
significant interstellar extinction.
The magnitudes of Sct were taken from the Sternberg
Institute's catalog of bright stars (Kornilov et al. 1991) and
converted to the standard Johnson system. If the interstellar
extinction is known for an object, then its luminosity class can
be also determined from this diagram. The interstellar extinction
for Sct being close to zero (Gaia DR 3; Green et al.
2015), its position in the diagram unambiguously suggests the
spectral type F2 II, to be compared to that in SIMBAD, F2 II-III.
3. Observations
The main part of observations for both stars were obtained at the
INASAN observatory in Simeiz, on Mount Koshka, using the
Zeiss-1000 telescope and an FLI16803 CCD, in the  photometric system, and the Zeiss-600 telescope with a
VersArray 512UV CCD, in the
photometric system, and the Zeiss-600 telescope with a
VersArray 512UV CCD, in the  photometric system. The
Zeiss-1000 and Zeiss-600 instruments are described in Nikolenko et
al. (2019). The details of the instrumental photometric
system are given in Barabanov et al. (2021). The transformation
coefficients for VersArray 512UV are given in Volkova & Volkov
(2026a).
photometric system. The
Zeiss-1000 and Zeiss-600 instruments are described in Nikolenko et
al. (2019). The details of the instrumental photometric
system are given in Barabanov et al. (2021). The transformation
coefficients for VersArray 512UV are given in Volkova & Volkov
(2026a).
Besides, HD 142989 was recently observed on five nights with the
ASA AZ800  6.85 80-cm reflector of the Technology Innovation
Institute Optical Ground Station (Abu Dhabi, United Arab Emirates)
equipped with the QHY174M
6.85 80-cm reflector of the Technology Innovation
Institute Optical Ground Station (Abu Dhabi, United Arab Emirates)
equipped with the QHY174M
 CMOS and a green filter
(4900-5800 Å) supplied with the sensor. Comparing the
instrumental differences between the comparison star GSC 6199 969
and the studied stars, obtained using FLI16803 and VersArray 512UV
CCDs with a QHY174M + 4900-5800 Åfilter, we find that the
instrumental system is quite close to the
CMOS and a green filter
(4900-5800 Å) supplied with the sensor. Comparing the
instrumental differences between the comparison star GSC 6199 969
and the studied stars, obtained using FLI16803 and VersArray 512UV
CCDs with a QHY174M + 4900-5800 Åfilter, we find that the
instrumental system is quite close to the  band. The
transformation formula is as follows:
band. The
transformation formula is as follows:
 |
(1) |
 color indices
should be determined from independent sources. The error of the
transformation coefficient is
color indices
should be determined from independent sources. The error of the
transformation coefficient is  . The instrumental system
is blue-shifted relative to the Johnson band.
. The instrumental system
is blue-shifted relative to the Johnson band.
We processed all observations using the Maxim DL program.
| Star | |
 |
|
 |
 |
 |
 |
 |
Sp |
| GSC 3989 1185 | 13.216 | 0.258 | 0.554 | 0.329 | 0.489 | 0.389 | 0.431 | 0.295 | A9 V |
 0.007 0.007 |
0.011 |
0.008 |
0.016 |
0.016 |
0.018 |
0.009 |
0.020 |
||
| HD142989 | 9.090 | 0.264 | 0.528 | 0.305 | 0.455 | 0.287 | 0.302 | 0.280 | A9 V |
| 0.004 |
0.023 |
0.007 |
0.021 |
0.018 |
0.044 |
0.043 |
0.020 |
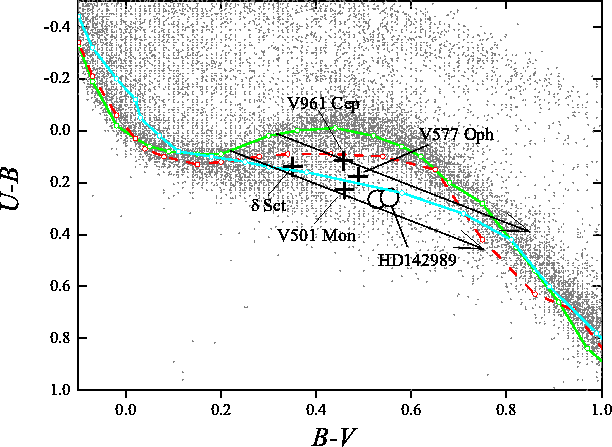 |
Fig. 1.
The |
4. Periodicity analysis
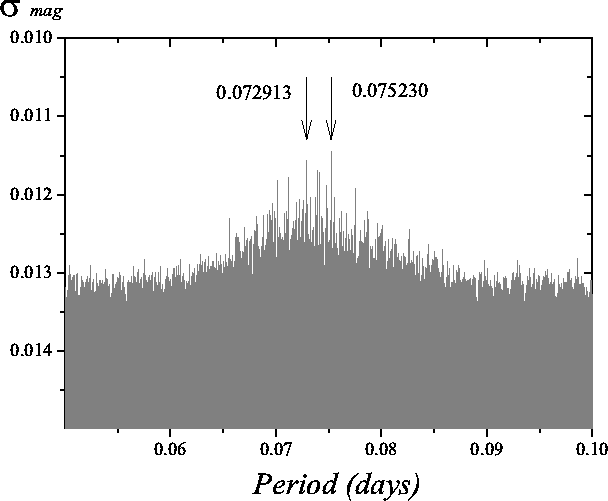
Data periodicity analysis was performed using our period search
algorithm (Volkov 2022). First, the peak with the maximum
amplitude was identified on the periodogram, see Fig. 2 for an
example. Then, the initial phase and amplitude of the
approximating sine curve were determined by minimizing residual
deviations using the next formula:

 are pulsation amplitudes,
  coincide
with phase
coincide
with phase  =0 of the corresponding sine curve,
  are the
pulsation periods,
are the
pulsation periods,
 is the corresponding magnitude
from Table 1. The sinusoid with obtained parameters was subtracted
from the overall data set, and the search was repeated. Thus, we
identified all the dominant oscillations. In the final stages of
the approximation, when all the dominant periods had been
established, the pulsation parameters, including the periods, were
refined using the least squares method. They are presented in
Tables 2 and 3.
is the corresponding magnitude
from Table 1. The sinusoid with obtained parameters was subtracted
from the overall data set, and the search was repeated. Thus, we
identified all the dominant oscillations. In the final stages of
the approximation, when all the dominant periods had been
established, the pulsation parameters, including the periods, were
refined using the least squares method. They are presented in
Tables 2 and 3.
The pulsation amplitudes of both stars were found to be within one
hundredth of a magnitude, therefore they should be attributed to
the low-amplitude subtype of Sct stars, DSCTC according
to Samus et al. (2017).
The magnitudes of both stars are given in Table 1.
5. GSC 3989 1185
This star served as one of comparison stars in the observations of
the eclipsing variable V340 Lac for more than 20 years (Volkova &
Volkov 2026b). Even during the early stages of the study, it was
suspected that either one of the comparison stars or V340 Lac
itself was experiencing slight physical oscillations. As the
observational base expanded, we discovered that it was
GSC 3989 1185, situated 30
 away from V340 Lac, that was
changing its brightness. Multicolor measurements of all
stars in the vicinity aided in the search for the pulsating star.
This star was excluded from the comparison stars, and the entire
data were reprocessed. As a result, we obtained seven data sets:
188 data points in the
away from V340 Lac, that was
changing its brightness. Multicolor measurements of all
stars in the vicinity aided in the search for the pulsating star.
This star was excluded from the comparison stars, and the entire
data were reprocessed. As a result, we obtained seven data sets:
188 data points in the  band; 519, in the
  band; 1290, in
the band; 319, in the
band; 1290, in
the band; 319, in the  band; 194, in the
  band; 268, in
the
band; 268, in
the  band; 139, in the
  band. The original data for every
band can be found in the appendix to the html version of this
paper as `3989 1185
band. The original data for every
band can be found in the appendix to the html version of this
paper as `3989 1185  .txt' files. The first column of the tables
indicates the Heliocentric Julian Date (HJD) of the observation,
understood as the midpoint of the exposure, and the second column
indicates the difference between the current star's magnitude and
its average level from Table 1 in the corresponding photometric
band, `'.
.txt' files. The first column of the tables
indicates the Heliocentric Julian Date (HJD) of the observation,
understood as the midpoint of the exposure, and the second column
indicates the difference between the current star's magnitude and
its average level from Table 1 in the corresponding photometric
band, `'.
Our observations in the photometric band, phased with the
derived periods, are displayed in Fig. 3. Pulsations with the
same periods are also clearly visible in the other photometric
bands, showing a noticeable tendency for the pulsation amplitude
to increase with decreasing observation wavelength. This behavior
is typical of DSCT variable stars.
 |
|
|
|
| 2,453,305+ | days | mag |
|
| 1 | 0.2583 | 0.07291306 | 0.0066 |
| 0.0002 |
0.00000003 |
0.0002 |
|
| 2 | 0.2590 | 0.07523032 | 0.0055 |
| 0.0002 |
0.00000003 |
0.0002 |
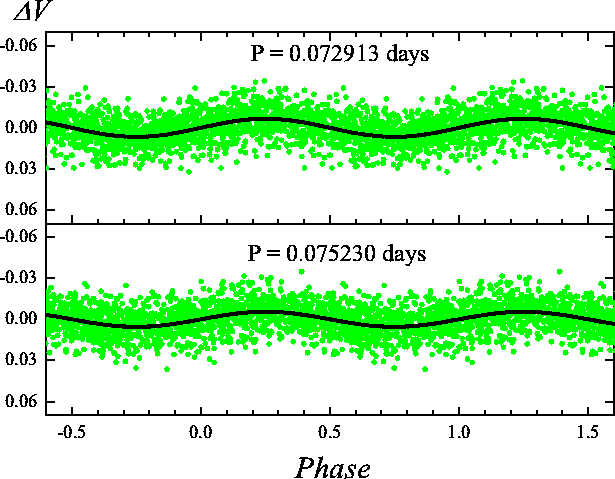 |
Fig. 3.
The light curves of GSC 3989 1185 in the
|
 , which corresponds to the precision of our
6. HD 142989
HD 142989 was used as a comparison star in observations of the
eclipsing variable BD -204369. We noticed that, during
synchronous observations with two telescopes, the shape of the
primary minimum was distorted in the same way. Therefore, the
detected systematic deviations could not be attributed to
instrumental effects or atmospheric extinction. The derived
magnitudes of HD 142989 showed that it fell within the
instability region in the diagram, where we had
already discovered a number of variable stars (see Fig. 1). Thus,
we had to reprocess all our observations using a fainter
comparison star GSC 6199 969 ( ). Over 14 years, we
accumulated a sufficient number of observations for a detailed
analysis.
). Over 14 years, we
accumulated a sufficient number of observations for a detailed
analysis.
To prevent saturation of the variable star measurements, the
exposure duration was limited to 5-10 seconds. All data were
averaged over approximately 5-20 frames to achieve an average
accuracy better than
 . These measurements are available
in an appendix to the html version of this paper as the text file ,
The contents of this table is similar to the
contents of the observation tables for the previous star.
magnitude to be added to the differences from the second column of
this table can be found in Table 1. The data were checked for
outliers. If a given measurement was logically unreliable (such as
clouds, a large air mass, or a sharp deterioration in the image),
that data point was discarded. In total, we obtained 1162
observations in band. Observations after JD 2461183 were
acquired in Abu Dhabi.
. These measurements are available
in an appendix to the html version of this paper as the text file ,
The contents of this table is similar to the
contents of the observation tables for the previous star.
magnitude to be added to the differences from the second column of
this table can be found in Table 1. The data were checked for
outliers. If a given measurement was logically unreliable (such as
clouds, a large air mass, or a sharp deterioration in the image),
that data point was discarded. In total, we obtained 1162
observations in band. Observations after JD 2461183 were
acquired in Abu Dhabi.
|
|
 |
|
|
| 2,460,775+ | days | mag |
|
| 1 | 0.4830 | 0.12439667 | 0.0070 |
| 0.0003 |
0.00000015 |
0.0002 |
|
| 2 | 0.5148 | 0.06753583 | 0.0048 |
| 0.0012 |
0.00000006 |
0.0001 |
|
| 3 | 0.6589 | 0.10837759 | 0.0043 |
| 0.0002 |
0.00000005 |
0.0002 |
|
| 4 | 0.5048 | 0.06314659 | 0.0040 |
| 0.0002 |
0.00000005 |
0.0002 |
|
| 5 | 0.5231 | 0.08100005 | 0.0026 |
| 0.0010 |
0.00000005 |
0.0002 |
|
| 6 | 0.5358 | 0.07644490 | 0.0022 |
| 0.0002 |
0.00000008 |
0.0006 |
We then tested how the identified pulsation parameters applied to individual nights. An example is shown in Fig. 4. Failure to account for any of the identified oscillations leads to increased errors on each observing night.
Our observations were separated by the following discrete
intervals: a day, a year-long observation window of approximately
four months, and 3.1 days. The last interval corresponds to the
orbital period of the neighboring eclipsing star BD-204369.
This is because almost all our observations were conducted during
the primary minimum of this star. The required value of the period
was chosen based on the minimum residual scatter of observation
points. All the detected periods are significant, and excluding
any of them from the analysis significantly increases the residual
scatter, O-C. If the sine functions with the found periods are
not subtracted, then the standard error of the scatter of
observations becomes
 . The resulting mean error in
the case when all six sine curves were extracted according to
formula (2) is
. The resulting mean error in
the case when all six sine curves were extracted according to
formula (2) is
 .
.
All periods from Table 3 were checked not to be aliases between each other.
It is possible that pulsations with other periods exist, but their
amplitudes must be smaller than  from Table 3. Our
observational accuracy is no longer sufficient to detect them.
from Table 3. Our
observational accuracy is no longer sufficient to detect them.
Our analysis of the TESS data (Stassun et al. 2019) revealed that
they contain a pair of periods (0 125 and 0109) plus the
period 0076445. All they are close to ours (see Table 3). We
found no traces of other periods in the TESS observations. Whether
this is due to the temporary disappearance of pulsations with
these periods during the week of TESS observations, or maybe due
to the specifics of the TESS processing, remains unclear.
125 and 0109) plus the
period 0076445. All they are close to ours (see Table 3). We
found no traces of other periods in the TESS observations. Whether
this is due to the temporary disappearance of pulsations with
these periods during the week of TESS observations, or maybe due
to the specifics of the TESS processing, remains unclear.
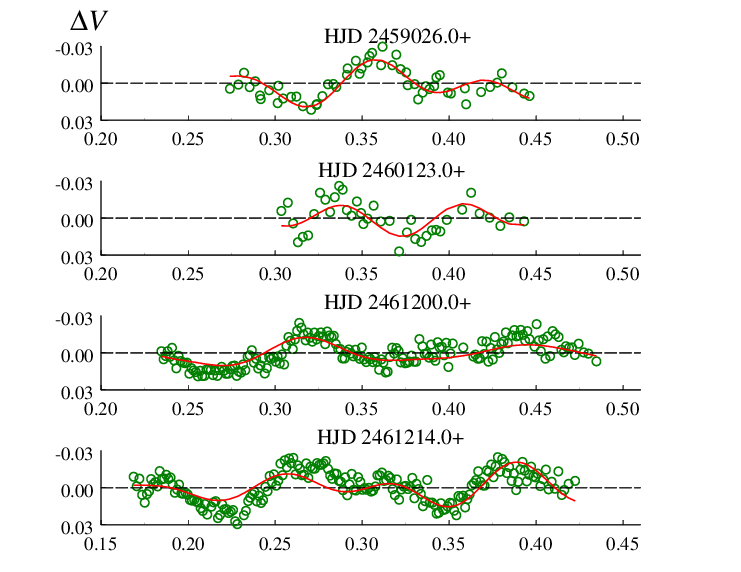 |
Fig. 4.
Four individual nights of observations
(green circles). Superposition of sine curves with parameters from
Table 3 (red curves). The rms deviation of individual measurement
for each night, from top to bottom, is
|
 ,
,
 ,
,
 .
.
Our multicolor observations of other stars confirm that the TESS
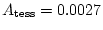
photometric band is close to (Volkov et al. 2024). The
amplitude of brightness variations for
 in TESS
observations was derived to be
in TESS
observations was derived to be
 , much lower
than in the band. This confirms the suggested DSCT variability
type.
, much lower
than in the band. This confirms the suggested DSCT variability
type.
Formula (2), along with data from Table 2, helped us to reduce
the scatter of our observations of the eclipsing star
BD-204369.
7. Conclusions
Our high-precision photometric observations allowed us to detect two new DSCT variables and to analyze their periodicity. GSC 3989 1185 has two periods stable for 20 years; HD 142989 has six periods, stable for 14 years of observations. These facts are of a significant interest for the theory of stellar pulsations.
We also point out that high-precision multicolor observations are suitable for spectral classification and subsequent temperature calibration with an accuracy rivaling that of spectroscopic measurements.
The coefficient for converting instrumental magnitudes from
QHY174M 1920 1200 CMOS sensor + 4900-5800 Å filter,
with which we have not worked before, into the standard Johnson
system was determined.
1200 CMOS sensor + 4900-5800 Å filter,
with which we have not worked before, into the standard Johnson
system was determined.
Acknowledgments: This work was carried out under the State Assignment of the Sternberg Astronomical Institute, Moscow State University.
Observations were partly conducted with the Zeiss-600 and Zeiss-1000 telescopes of the Terskol Observatory Collective Use Center of INASAN.
We express our sincere gratitude to K.S. Kravtsov for conducting remote observations at the Technology Innovation Institute Optical Ground Station in Abu Dhabi.
Thanks are due to Prof. N. Samus for helpful discussions and criticism.
This study used the SIMBAD database of the Strasbourg Astronomical Data Center (France) and the ADS bibliographic service (NASA, USA).
References:
Barabanov, S. I., Potanin, S. A., Savvin, A. D., et al. 2021, INASAN Science Reports, 6, 92
Flower, P. J. 1996, Astrophys. J., 469, 355
Green, G. M., Schlafly, E. F., Finkbeiner, D. P., et al. 2015, Astrophys. J., 810, No. 1, article id. 25
Kornilov, V. G., Volkov, I. M., Zakharov, A. I., et al. 1991, Tr. Gos. Astron. Inst. 63, 4
Mermilliod, J. C., Mermilliod, M., & Hauck, B. 1997, Astron. & Astrophys. Suppl. Ser., 124, 349
Nikolenko, I. V., Kryuchkov, S. V., Barabanov, S. I., & Volkov, I. M. 2019, INASAN Science Reports, 4, 85
Samus, N. N., Kazarovets E. V., Durlevich O. V., et al. 2017, Astron. Rep., 61, No. 1, 80
Stassun, K. G., Oelkers, R. J., Paegert, M., et al. 2019, Astron. J., 158, No. 4, article id. 138
Straizys, V. 1992, Multicolor Stellar Photometry (Pachart Pub. House, Tucson)
Volkov, I. M. 1990, IBVS, No.3493
Volkov, I. M. 2022, Perem. Zvezdy, 42, No. 1, 1
Volkov, I. M. 2024, Perem. Zvezdy, 44, No. 4, 42
Volkov, I. M. & Volkova, N. S. 2009, Astron. Rep., 53, No. 2, 136
Volkov, I. M. & Volkova, N. S. 2010, ASP Conf. Ser., 435, 323
Volkov, I. M., Volkova, A. S., & Bagaev, L. A. 2024, Astron. Rep., 68, No. 9, 886
Volkov, I. M., Volkova, N. S., & Chochol, D. 2010, Astron. Rep., 54, No. 5, 418
Volkova, A. S. & Volkov, I. M. 2025, Astron. Rep., 69, No. 6, 480
Volkova, A. S. & Volkov, I. M. 2026a, Astrophys. Bull., 81, No. 3, 360
Volkova, A. S. & Volkov, I. M. 2026b, Astron. Rep., 70, No. 5, 547