|
Peremennye Zvezdy (Variable Stars) 26, No. 5, 2006 Received 5 May; accepted 5 July.
|
Article in PDF |
The Emission Spectrum of T Tau in 1971-1979
Ismailov, N.Z.; Guliev, N.Kh.; Aliyeva, A.A.
Shamakha Astrophysical Observatory, National Academy
of Sciences of Azerbaijan, Shamakha, Azerbaijan
E-mail: Box1955n@yahoo.com
1. Introduction
The star T Tau is the prototype of pre-main sequence (PMS)
low-mass T Tauri-type stars, which are at an early stage of
evolution. Numerous spectral and photometric observations, carried
out during many years, revealed strong variability of this unique
star's emission spectrum and visual light (Joy 1945, Herbig 1977,
Ismailov 1974, Zaitseva 1978, Zaitseva and Kolotilov 1977).
Sometimes, the light curve shows quasi-periodic light variations
with a period of 2![]() 8 (Zaitseva 1978, Herbst et al. 1987).
Recently, a long-period wave in the star's brightness, with a
nearly 6-year period, was detected (Ismailov and Samus 2003,
Mel'nikov and Grankin 2005).
8 (Zaitseva 1978, Herbst et al. 1987).
Recently, a long-period wave in the star's brightness, with a
nearly 6-year period, was detected (Ismailov and Samus 2003,
Mel'nikov and Grankin 2005).
Studies of the recent 20 years demonstrate that T Tau is an
exceptional member of the class, a triple system, with an
infrared southern component (T Tau S) in 0
![]() 7 from the
northern component (T Tau N) (Dyck et al. 1982). T Tau S is itself
a binary, with a projected separation of 0
7 from the
northern component (T Tau N) (Dyck et al. 1982). T Tau S is itself
a binary, with a projected separation of 0
![]() 07 (Koresko
2000). Solf and Böhm (1999) found that both T Tau N and T Tau S
possessed bipolar jets, the two jet systems directed
perpendicularly. From spectroscopy, Tracy et al. (2001) revealed
evidence for accretion of matter on T Tau S. The data from Loinard
et al. (2003) demonstrate relative motions of the IR components
of T Tau S. They show that the lower-mass component, T Tau Sb, is
running away from the system.
07 (Koresko
2000). Solf and Böhm (1999) found that both T Tau N and T Tau S
possessed bipolar jets, the two jet systems directed
perpendicularly. From spectroscopy, Tracy et al. (2001) revealed
evidence for accretion of matter on T Tau S. The data from Loinard
et al. (2003) demonstrate relative motions of the IR components
of T Tau S. They show that the lower-mass component, T Tau Sb, is
running away from the system.
During 1971-1988, Z.A. Ismailov carried out long-time homogenous low-resolution spectroscopy of T Tau at Shamakha Observatory. Some of the results based on these observations have already been published by different authors (Ismailov 1972, 1973, Guliev, 1991, 1994, Ismailov and Rustamov 1999). Below we briefly remind the basic results from this spectroscopy and from spectroscopic data by other authors.
Synchronous increase of line intensities of hydrogen H![]() ,
H
,
H![]() , H
, H![]() and of H and K CaII emission lines, nearly
threefold in 3 hours, was discovered (Ismailov 1974). During the
star's transition from photometric quiescence to a more active
state, variations of the H
and of H and K CaII emission lines, nearly
threefold in 3 hours, was discovered (Ismailov 1974). During the
star's transition from photometric quiescence to a more active
state, variations of the H![]() emission line profile from
night to night, evidencing for mass loss from the star, were
observed. The intensity of the H
emission line profile from
night to night, evidencing for mass loss from the star, were
observed. The intensity of the H![]() emission increased with
increasing UV excess (Zaytseva 1978). 90-120 min and 18-20-day
quasi-cyclic variations of equivalent widths and radial velocities
of hydrogen lines and flare activity in the H, K CaII lines were
revealed by Guliev (1991, 1994). The star's spectral type can be
described as G8-K0V, its radial velocity is 20-22 km/s (Herbig
1977, Rustamov 1999).
emission increased with
increasing UV excess (Zaytseva 1978). 90-120 min and 18-20-day
quasi-cyclic variations of equivalent widths and radial velocities
of hydrogen lines and flare activity in the H, K CaII lines were
revealed by Guliev (1991, 1994). The star's spectral type can be
described as G8-K0V, its radial velocity is 20-22 km/s (Herbig
1977, Rustamov 1999).
In this paper, we present parameters of emission spectral lines determined from our complete spectroscopic material for 1971-1979.
2. Observations and Results
Our spectroscopic observations were carried out in the Cassegrain
focus of the 2 m telescope of the Shamakha Observatory (National
Academy of Sciences, Azerbaijan) using the ![]() prism
spectrograph with inverse dispersion 94 Å/mm at H
prism
spectrograph with inverse dispersion 94 Å/mm at H![]() . The
spectral range was
. The
spectral range was
![]() Å. The spectra
were reduced using standard techniques (Guliev 1994, Ismailov and
Rustamov 1999). We used microphotometer tracing with a
magnification of 40 to measure equivalent widths of the strongest
emission spectral lines: H
Å. The spectra
were reduced using standard techniques (Guliev 1994, Ismailov and
Rustamov 1999). We used microphotometer tracing with a
magnification of 40 to measure equivalent widths of the strongest
emission spectral lines: H![]() -H
-H![]() , H and K CaII,
[SII]
, H and K CaII,
[SII] ![]() Å. Mean standard errors of the equivalent
widths were within 15%, those of the radial velocities, within
Å. Mean standard errors of the equivalent
widths were within 15%, those of the radial velocities, within
![]() km/s.
km/s.
Table 1 presents all measurements of ![]() (in Å) and
(in Å) and
![]() (in km/s) for the program emission lines.
(in km/s) for the program emission lines.
Table 1. The spectroscopic observations of HD 200775
| Sp. | JD | H |
H |
H |
H |
[SII] |
H CaII | K CaII | |||||
| No. | 2440000+ | ||||||||||||
| 1 | 989.143 | 3.9 | - | - | - | - | - | 0.6 | - | 1.8 | - | 2.2 | - |
| 2 | 989.158 | 4.3 | - | - | - | - | - | 0.6 | - | 2.7 | - | 2.6 | - |
| 3 | 989.171 | 2.6 | 20 | - | - | - | - | 0.9 | - | 2.9 | - | 2.2 | - |
| 4 | 989.187 | 6.2 | 144 | - | - | - | - | 0.3 | - | 2.4 | - | 2.6 | - |
| 5 | 989.201 | 2.4 | 97 | - | - | - | - | 0.4 | - | 1.5 | - | 1.5 | - |
| 6 | 989.237 | 2.1 | - | - | - | - | - | 0.4 | - | 1.5 | - | 1.2 | - |
| 7 | 989.251 | 4.6 | - | - | - | - | - | 1.1 | - | 1.3 | - | 1.3 | - |
| 8 | 989.274 | 3.8 | - | - | - | - | - | 0.9 | - | 0.5 | - | 0.9 | - |
| 9 | 990.521 | 1.2 | - | - | - | - | - | - | - | 1.2 | - | 1.4 | - |
| 10 | 990.535 | 2.4 | - | - | - | - | - | - | - | 1.1 | - | 1.3 | - |
| 11 | 990.551 | 4.2 | - | - | - | - | - | - | - | 1.9 | - | 1.5 | - |
| 12 | 990.565 | 3.5 | - | - | - | - | - | - | - | 1.6 | - | 1.6 | - |
| 13 | 995.221 | 2.3 | - | - | - | - | - | - | - | 1.5 | - | 1.8 | - |
| 14 | 995.551 | 2.0 | - | - | - | - | - | - | - | 1.9 | - | 1.5 | - |
| 15 | 998.512 | 2.2 | - | - | - | - | - | - | - | 1.6 | - | 1.5 | - |
| 16 | 998.531 | 3.4 | - | - | - | - | - | - | - | 1.1 | - | 1.1 | - |
| 17 | 998.550 | 4.9 | - | - | - | - | - | - | - | 1.5 | - | 1.3 | - |
| 18 | 1294.135 | 5.4 | - | - | - | - | - | - | - | 4.3 | - | 3.4 | - |
| 19 | 1294.159 | 4.9 | - | - | - | - | - | - | - | 5.0 | - | 2.6 | - |
| 20 | 1294.180 | 7.4 | - | - | - | - | - | - | - | 3.5 | - | 2.6 | - |
| 21 | 1294.202 | 3.9 | - | - | - | - | - | - | - | 2.2 | - | 1.6 | - |
| 22 | 1294.222 | 2.6 | - | - | - | - | - | - | - | 2.3 | - | 2.8 | - |
| 23 | 1294.246 | 6.2 | - | - | - | - | - | - | - | 2.4 | - | 2.2 | - |
| 24 | 1294.267 | 5.5 | - | - | - | - | - | - | - | 2.6 | - | 1.7 | - |
| 25 | 1294.291 | 4.8 | - | - | - | - | - | - | - | 1.8 | - | 1.7 | - |
| 26 | 1294.311 | 4.3 | - | - | - | - | - | - | - | 1.3 | - | 0.9 | - |
| 27 | 1294.334 | 4.8 | - | - | - | - | - | - | - | 1.9 | - | 1.5 | - |
| 28 | 1294.335 | 6.1 | - | - | - | - | - | - | - | 1.6 | - | 2.0 | - |
| 29 | 1374.550 | 5.4 | 22 | - | - | - | - | - | - | 2.6 | - | 2.5 | - |
| 30 | 1374.568 | 6.5 | 102 | - | - | - | - | - | - | 2.4 | - | 2.2 | - |
| 31 | 1374.588 | 7.3 | 90 | - | - | - | - | - | - | 2.2 | - | 1.7 | - |
| 32 | 1374.603 | 6.2 | 53 | - | - | - | - | - | - | 1.7 | - | 1.5 | - |
| 33 | 1374.617 | 5.6 | 54 | - | - | - | - | - | - | 2.2 | - | 2.1 | - |
| 34 | 1374.635 | 5.1 | 92 | - | - | - | - | - | - | 2.4 | - | 2.3 | - |
| 35 | 1374.656 | 5.3 | 76 | - | - | - | - | - | - | 2.6 | - | 2.4 | - |
Table 1 (continued)
| Sp. | JD | H |
H |
H |
H |
[SII] |
H CaII | K CaII | |||||
| No. | 2440000+ | ||||||||||||
| 36 | 1669.244 | 2.7 | - | - | - | - | - | - | - | 1.8 | - | 1.6 | - |
| 37 | 1669.268 | 3.0 | - | - | - | - | - | - | - | 1.4 | - | 1.2 | - |
| 38 | 2433.177 | 8.4 | 107 | 3.5 | -20 | 1.1 | - | - | - | 6.7 | 67 | 4.8 | 57 |
| 39 | 2433.201 | 12.3 | 92 | 5.6 | 94 | 2.1 | - | 0.3 | - | 9.6 | 72 | 6.0 | 98 |
| 40 | 2433.222 | 10.1 | 168 | 3.3 | 140 | 3.0 | - | 1.0 | - | 13.4 | 80 | 13.9 | 109 |
| 41 | 2433.244 | 11.3 | 133 | 4.4 | 146 | 4.4 | - | 2.2 | - | 11.3 | 27 | 12.3 | 91 |
| 42 | 2433.264 | 7.5 | 100 | 3.7 | 128 | 4.6 | - | 0.9 | - | 9.7 | 16 | 10.1 | 70 |
| 43 | 2433.288 | 9.8 | 76 | 4.4 | 100 | 3.2 | - | 1.0 | - | 10.8 | 24 | 7.1 | 73 |
| 44 | 2433.309 | 6.9 | 141 | 1.6 | 28 | 1.5 | - | - | - | 5.7 | 30 | 4.9 | 73 |
| 45 | 2433.333 | 5.2 | - | 2.7 | - | 2.4 | - | 1.6 | - | 6.4 | - | 5.2 | - |
| 46 | 2433.353 | 7.9 | - | 2.1 | - | 1.2 | - | 0.8 | - | 3.2 | - | 4.2 | - |
| 47 | 2433.376 | 6.7 | - | 2.7 | - | 1.0 | - | - | - | 8.3 | - | 8.8 | - |
| 48 | 2433.397 | 8.1 | - | 2.5 | - | - | - | - | - | 6.1 | - | 6.8 | - |
| 49 | 2762.401 | 5.6 | - | - | - | - | - | - | - | 3.6 | - | 4.1 | - |
| 50 | 2762.412 | 5.3 | - | - | - | - | - | - | - | 3.6 | - | 3.5 | - |
| 51 | 2762.424 | 5.1 | - | - | - | - | - | - | - | 4.6 | - | 4.6 | - |
| 52 | 2762.435 | 4.6 | - | - | - | - | - | - | - | 3.4 | - | 4.1 | - |
| 53 | 2762.447 | 5.1 | - | - | - | - | - | - | - | 3.6 | - | 3.9 | - |
| 54 | 2762.458 | 4.7 | - | - | - | - | - | - | - | 3.6 | - | 3.2 | - |
| 55 | 2762.469 | 4.3 | - | - | - | - | - | - | - | 3.4 | - | 3.6 | - |
| 56 | 2762.480 | 3.3 | - | - | - | - | - | - | - | 4.4 | - | 4.6 | - |
| 57 | 2762.491 | 3.5 | - | - | - | - | - | - | - | 3.4 | - | 3.9 | - |
| 58 | 2762.502 | 4.1 | - | - | - | - | - | - | - | 3.2 | - | 3.4 | - |
| 59 | 2762.513 | 5.2 | - | - | - | - | - | - | - | 4.1 | - | 4.4 | - |
| 60 | 2762.524 | 5.5 | - | - | - | - | - | - | - | 4.4 | - | 4.6 | - |
| 61 | 2762.538 | 5.4 | - | - | - | - | - | - | - | 4.6 | - | 4.6 | - |
| 62 | 2762.548 | 5.8 | - | - | - | - | - | - | - | 4.1 | - | 4.5 | - |
| 63 | 2762.560 | 4.5 | - | - | - | - | - | - | - | 4.9 | - | 4.6 | - |
| 64 | 2772.309 | 16.8 | 71 | 8.2 | 99 | 4.5 | 2.3 | 2.6 | 65 | 11.3 | 80 | 13.6 | 86 |
| 65 | 2773.344 | 11.9 | 67 | 6.1 | 110 | 3.0 | 2.5 | 1.0 | 83 | 13.3 | 83 | 12.1 | 108 |
| 66 | 2773.367 | 13.0 | 113 | 5.0 | 96 | 4.0 | 1.6 | 1.5 | 96 | 8.1 | 64 | 8.7 | 97 |
| 67 | 2774.156 | 15.1 | 143 | 9.4 | 151 | 5.1 | 5.1 | 2.5 | 19 | 14.2 | 158 | 13.2 | 202 |
| 68 | 2774.180 | 13.4 | 99 | 6.3 | 144 | 4.9 | 3.9 | 1.2 | 27 | 12.0 | 178 | 12.6 | 126 |
| 69 | 2774.203 | 10.8 | 148 | 7.6 | 112 | 4.8 | 5.3 | 1.3 | 46 | 14.2 | 126 | 11.9 | 115 |
| 70 | 2774.227 | 12.9 | 100 | 8.9 | 82 | 4.7 | 4.8 | 2.7 | 41 | 19.0 | 110 | 17.3 | 123 |
| 71 | 2774.250 | 13.8 | 169 | 6.2 | 108 | 5.7 | 4.1 | 2.7 | 56 | 17.1 | 115 | 20.8 | 121 |
| 72 | 2774.271 | 10.6 | 101 | 6.9 | 145 | 6.1 | 3.2 | 1.8 | 71 | 15.4 | 114 | 16.0 | 98 |
| 73 | 2774.297 | 11.5 | 131 | 7.9 | 85 | 5.5 | 3.7 | 2.3 | 52 | 14.7 | 101 | 14.8 | 118 |
| 74 | 2774.320 | 11.9 | -31 | 7.4 | 90 | 5.3 | 2.3 | 2.0 | -21 | 14.9 | 68 | 13.9 | 69 |
| 75 | 2774.344 | 12.4 | 110 | 7.3 | 125 | 5.3 | 2.7 | 1.5 | 36 | 14.0 | 89 | 14.0 | 100 |
| 76 | 2774.367 | 9.8 | 25 | 6.5 | 65 | 3.9 | 3.3 | 1.2 | 30 | 12.1 | 96 | 12.5 | 113 |
| 77 | 2774.391 | 10.0 | 89 | 5.4 | 108 | 3.2 | 3.2 | 1.6 | 69 | 9.1 | 96 | 9.0 | 93 |
| 78 | 2774.414 | 9.7 | 53 | 4.9 | 68 | 4.1 | 0.9 | 2.2 | 23 | 7.6 | 94 | 8.2 | 94 |
| 79 | 2774.437 | 10.4 | 106 | 5.5 | 112 | 3.9 | 2.2 | 1.2 | 66 | 10.0 | 108 | 9.5 | 112 |
| 80 | 2796.192 | 7.8 | 60 | 3.0 | 79 | 1.0 | - | 1.3 | - | 6.4 | 58 | 8.7 | 69 |
| 81 | 2797.276 | 5.6 | 80 | 2.5 | 68 | - | - | 1.1 | - | 6.0 | 58 | 6.1 | 80 |
| 82 | 2800.142 | 4.7 | 46 | 2.2 | 37 | - | - | 1.3 | - | 4.3 | 49 | 5.1 | 79 |
| 83 | 3162.261 | 6.4 | 31 | 1.6 | 20 | 1.4 | - | - | - | 8.5 | 45 | 8.3 | 75 |
| 84 | 3162.303 | 5.5 | 63 | 1.1 | -19 | 1.0 | - | - | - | 5.4 | 61 | 6.2 | 72 |
| 85 | 3164.271 | 5.0 | - | 1.0 | - | 0.6 | - | - | - | 5.0 | - | 4.8 | - |
| 86 | 3169.133 | 7.1 | -5 | 1.3 | 44 | 1.0 | - | - | - | 3.0 | 26 | 2.8 | 37 |
| 87 | 3169.228 | 6.9 | 5 | 0.8 | 90 | 0.6 | - | - | - | 3.9 | 11 | 3.6 | 57 |
| 88 | 3169.272 | 4.2 | 75 | 0.7 | 60 | 0.5 | - | - | - | 2.7 | 11 | 2.8 | 93 |
| 89 | 3169.313 | 6.5 | 18 | 0.9 | 86 | 0.5 | - | - | - | 2.1 | 70 | 2.2 | 110 |
| 90 | 3170.181 | 6.7 | -3 | 1.2 | 50 | 0.7 | - | - | - | 1.5 | 52 | 1.6 | 51 |
Table 1 (continued)
| Sp. | JD | H |
H |
H |
H |
[SII] |
H CaII | K CaII | |||||
| No. | 2440000+ | ||||||||||||
| 91 | 3170.330 | 6.7 | - | 1.5 | - | 1.1 | 0.8 | - | - | 4.6 | - | 4.9 | - |
| 92 | 3171.129 | 6.5 | - | 1.0 | - | 0.5 | 0.6 | - | - | 4.3 | - | 4.7 | - |
| 93 | 3171.171 | 6.7 | - | 2.9 | - | 1.0 | 0.7 | - | - | 8.4 | 59 | 7.8 | 59 |
| 94 | 3171.214 | 7.6 | - | 1.2 | - | 0.8 | 1.1 | - | - | 7.8 | - | 7.6 | - |
| 95 | 3171.259 | 6.5 | - | 3.7 | - | 0.6 | 0.7 | - | - | 6.4 | 73 | 6.0 | 90 |
| 96 | 3171.296 | 5.5 | - | 1.4 | - | 0.8 | 0.9 | - | - | 6.2 | 79 | 6.6 | 69 |
| 97 | 3171.324 | 5.6 | - | 0.8 | - | 0.5 | 0.6 | - | - | 6.1 | 72 | 6.2 | 83 |
| 98 | 3203.150 | 5.4 | - | 1.5 | - | 0.9 | 0.7 | - | - | 5.0 | 71 | 4.7 | 75 |
| 99 | 3203.185 | 7.5 | 97 | 1.8 | 37 | 1.2 | 1.0 | - | - | 7.8 | 59 | 7.7 | 71 |
| 100 | 3482.246 | 6.1 | 34 | 1.2 | 77 | 0.8 | 1.2 | - | - | 10.8 | 89 | 10.6 | 78 |
| 101 | 3482.283 | 11.6 | 11 | 3.2 | 14 | 1.2 | 0.9 | - | - | 7.8 | 22 | 7.6 | 46 |
| 102 | 3496.198 | 9.8 | -236 | 2.3 | -79 | 1.8 | 1.1 | - | - | 10.5 | 21 | 10.0 | 31 |
| 103 | 3496.235 | 9.4 | -17 | 1.9 | 88 | 1.0 | 0.7 | - | - | 5.4 | 54 | 5.1 | 89 |
| 104 | 3496.269 | 10.7 | -15 | 2.6 | 75 | 0.7 | 0.7 | - | - | 5.8 | 54 | 5.6 | 59 |
| 105 | 3497.236 | 5.7 | -36 | 1.9 | - | 0.9 | 0.6 | - | - | 6.2 | 53 | 6.0 | 74 |
| 106 | 3498.208 | 3.0 | -83 | 0.7 | - | - | - | - | - | 5.0 | 44 | 4.8 | 40 |
| 107 | 3503.194 | 2.8 | - | 0.6 | - | - | - | - | - | 4.8 | - | 4.4 | - |
| 108 | 3503.233 | 7.7 | 89 | 1.8 | 58 | 1.1 | 0.9 | - | - | 6.6 | 48 | 6.8 | 73 |
| 109 | 3503.269 | 6.6 | - | 1.6 | - | 0.9 | 0.9 | - | - | 3.8 | - | 4.2 | - |
| 110 | 3503.312 | 6.9 | - | 1.7 | 58 | 0.8 | 0.7 | - | - | 5.1 | 45 | 5.4 | 59 |
| 111 | 3503.312 | 6.0 | -22 | 1.3 | 83 | 0.6 | 0.8 | - | - | 4.1 | 43 | 3.7 | 89 |
| 112 | 3503.341 | 5.7 | -119 | 1.1 | 65 | 0.6 | 0.6 | - | - | 4.2 | 44 | 4.4 | 40 |
| 113 | 3503.397 | 4.9 | -158 | 0.9 | 42 | 0.5 | 0.6 | - | - | 4.3 | 52 | 4.0 | 81 |
| 114 | 3504.172 | 8.2 | -66 | 2.4 | 20 | 0.9 | 0.6 | - | - | 5.3 | 58 | 5.6 | 64 |
| 115 | 3504.200 | 9.4 | -54 | 3.7 | 67 | 0.8 | 0.7 | - | - | 6.3 | 47 | 6.8 | 53 |
| 116 | 3504.231 | 8.0 | 54 | 2.6 | 82 | 1.2 | 1.0 | - | - | 4.3 | 40 | 4.5 | 65 |
| 117 | 3504.262 | 7.5 | -117 | 2.4 | 62 | 0.5 | 0.8 | - | - | 4.6 | 53 | 4.8 | 82 |
| 118 | 3504.309 | 7.7 | - | 1.8 | - | 0.6 | 0.8 | - | - | 5.6 | 49 | 6.6 | 87 |
| 119 | 3504.339 | 10.8 | 22 | 3.0 | - | 0.8 | 0.6 | - | - | 5.0 | 52 | 5.4 | 81 |
| 120 | 3506.218 | 14.1 | - | 2.9 | - | 1.1 | 1.1 | - | - | 9.1 | - | 9.4 | - |
| 121 | 3506.255 | 16.1 | - | 3.7 | - | 1.4 | 1.2 | - | - | 9.7 | - | 10.8 | - |
| 122 | 3510.177 | 14.8 | - | 5.5 | 93 | 2.6 | 0.7 | - | - | 9.4 | 60 | 9.0 | 70 |
| 123 | 3510.219 | 13.8 | - | 4.8 | 119 | 2.3 | 1.1 | - | - | 8.4 | 56 | 8.1 | 62 |
| 124 | 3510.253 | 14.4 | 86 | 4.1 | 88 | 3.7 | 1.8 | - | - | 12.8 | 41 | 12.5 | 82 |
| 125 | 3510.271 | 15.5 | 63 | 5.1 | 70 | 2.8 | 2.6 | - | - | 13.9 | 38 | 12.9 | 80 |
| 126 | 3510.299 | 13.2 | 54 | 6.2 | 63 | 2.3 | 0.9 | - | - | 12.8 | 37 | 13.3 | 74 |
| 127 | 3510.335 | 20.3 | 120 | 4.3 | 69 | 2.2 | 0.8 | - | - | 12.1 | 38 | 12.2 | 78 |
| 128 | 3511.128 | 30.8 | -3 | 14.0 | 57 | 6.3 | 0.9 | - | - | 13.0 | 40 | 12.5 | 82 |
| 129 | 3511.158 | 22.1 | 110 | 15.0 | 48 | 7.2 | 1.1 | - | - | 11.1 | 44 | 10.8 | 81 |
| 130 | 3511.186 | 24.4 | 42 | 17.0 | 86 | 6.0 | 0.4 | - | - | 10.7 | 41 | 9.8 | 90 |
| 131 | 3511.266 | 23.9 | - | 17.0 | - | 6.3 | 0.8 | - | - | 7.9 | - | 6.9 | - |
| 132 | 3511.297 | 19.2 | 30 | 13.0 | 53 | 5.3 | 0.5 | - | - | 6.7 | 47 | 5.8 | 57 |
| 133 | 3512.222 | 17.5 | 125 | 5.2 | 129 | 2.1 | 1.4 | - | - | 13.4 | 51 | 13.7 | 95 |
| 134 | 3512.251 | 14.2 | 116 | 4.8 | 78 | 1.7 | 1.2 | - | - | 12.8 | 84 | 13.2 | 78 |
| 135 | 3512.279 | 16.5 | 87 | 6.1 | 74 | 2.9 | 1.2 | - | - | 10.6 | 72 | 10.9 | 85 |
| 136 | 3512.314 | 15.3 | 100 | 5.7 | 93 | 3.2 | 1.5 | - | - | 12.4 | 90 | 12.8 | 92 |
| 137 | 3512.342 | 22.4 | 99 | 6.4 | 90 | 2.8 | 1.5 | - | - | 12.6 | 78 | 12.8 | 102 |
| 138 | 3512.371 | 17.9 | - | 6.8 | - | 3.2 | 1.3 | - | - | 17.7 | - | 18.0 | - |
| 139 | 3512.410 | 24.2 | - | 7.0 | - | 2.6 | 1.5 | - | - | 13.4 | - | 13.5 | - |
| 140 | 3521.283 | 8.1 | -54 | 4.9 | 46 | - | - | - | - | 7.5 | 53 | 7.3 | 79 |
| 141 | 3521.314 | 9.6 | -3 | 5.2 | 73 | - | - | - | - | 7.2 | 41 | 7.1 | 88 |
| 142 | 3521.345 | 7.8 | 71 | 4.9 | 26 | 2.5 | 0.9 | - | - | 6.8 | 46 | 6.6 | 70 |
| 143 | 3568.230 | 6.1 | - | 2.7 | - | 1.6 | 0.6 | - | - | 6.7 | - | 6.3 | - |
| 144 | 3568.254 | 9.5 | - | 4.5 | - | 2.4 | 0.8 | - | - | 6.1 | - | 6.1 | - |
| 145 | 3585.257 | 5.2 | 39 | 2.6 | 45 | 0.8 | 0.5 | - | - | 7.7 | - | 8.0 | - |
Table 1 (continued)
| Sp. | JD | H |
H |
H |
H |
[SII] |
H CaII | K CaII | |||||
| No. | 2440000+ | ||||||||||||
| 146 | 3585.301 | 7.5 | 46 | 1.7 | 52 | 0.7 | 0.4 | - | - | 3.5 | - | 3.7 | - |
| 147 | 3560.226 | 5.0 | 25 | 1.5 | 46 | 1.3 | 0.8 | - | - | 4.6 | - | 3.4 | - |
| 148 | 3560.324 | 6.8 | 49 | 2.1 | 29 | 1.5 | 0.9 | - | - | 3.2 | - | 4.2 | - |
| 149 | 3861.157 | 4.0 | 66 | 1.1 | 54 | 1.1 | 0.6 | - | - | 3.5 | - | 3.8 | - |
| 150 | 3861.181 | 3.3 | 67 | 1.3 | 62 | 0.7 | 0.7 | - | - | 2.2 | - | 2.0 | - |
| 151 | 3861.208 | 3.6 | 32 | 1.3 | 70 | 0.8 | 0.6 | - | - | 2.1 | - | 1.9 | - |
| 152 | 3861.234 | 4.0 | 68 | 0.9 | 18 | 0.7 | 0.7 | - | - | 2.5 | - | 2.2 | - |
| 153 | 3861.281 | 3.6 | 35 | 0.7 | 55 | 0.6 | 0.5 | - | - | 3.1 | 44 | 2.1 | 41 |
| 154 | 3861.321 | 2.8 | 33 | 0.7 | 63 | 0.6 | 0.6 | - | - | 2.2 | - | 2.5 | - |
| 155 | 3861.363 | 2.8 | 40 | 0.7 | 42 | 0.6 | 0.6 | - | - | 2.3 | - | 2.2 | - |
| 156 | 3861.403 | 1.5 | 51 | 0.6 | 39 | 0.5 | 0.5 | - | - | 2.6 | - | 2.4 | - |
| 157 | 3563.217 | 6.9 | 40 | 1.3 | 57 | 0.9 | 0.8 | - | - | 3.1 | 61 | 2.8 | 104 |
| 158 | 3563.238 | 2.4 | 63 | 0.9 | 67 | 0.6 | 0.6 | - | - | 1.3 | - | 1.2 | - |
| 159 | 3563.260 | 5.8 | - | 1.1 | - | 0.7 | 0.5 | - | - | 2.5 | - | 2.3 | - |
| 160 | 3866.380 | 8.9 | 15 | 2.6 | 13 | 1.8 | 0.8 | - | - | 5.9 | - | 6.1 | - |
| 161 | 3869.406 | 3.8 | 3 | 2.2 | - | 1.8 | 0.6 | - | - | 7.0 | - | 6.8 | - |
| 162 | 3869.428 | 2.8 | -53 | 2.1 | - | 1.6 | 0.6 | - | - | 5.2 | - | 5.1 | - |
| 163 | 3887.281 | 6.9 | 96 | 3.0 | 92 | 2.1 | 0.5 | - | - | 4.2 | - | 4.0 | - |
| 164 | 3887.310 | 5.9 | 125 | 2.8 | 89 | 1.8 | 0.6 | - | - | 4.0 | - | 4.2 | - |
| 165 | 3901.187 | 16.4 | - | 3.7 | - | 2.1 | 0.7 | - | - | 8.2 | 79 | 8.4 | 55 |
| 166 | 3901.211 | 10.1 | 104 | 3.3 | 85 | 2.0 | 0.7 | - | - | 10.6 | 71 | 10.3 | 36 |
| 167 | 3901.236 | 11.1 | 42 | 2.2 | 108 | 1.7 | 0.6 | - | - | 11.9 | 33 | 11.5 | 57 |
To compare the star's brightness variations to our spectral
parameters, we used ![]() -band measurements from the Wesleyan
University photometric database for young stars (Herbst et al.,
1994). The results of this comparison are presented in Fig. 1.
Its top panel shows equivalent widths (
-band measurements from the Wesleyan
University photometric database for young stars (Herbst et al.,
1994). The results of this comparison are presented in Fig. 1.
Its top panel shows equivalent widths (![]() ) of the
H
) of the
H![]() and H
and H![]() emissions versus time, the middle panel
presents radial velocities of the H
emissions versus time, the middle panel
presents radial velocities of the H![]() emission, and the
bottom panel displays the
emission, and the
bottom panel displays the ![]() -band light curve for the time
interval of our spectroscopy.
-band light curve for the time
interval of our spectroscopy.
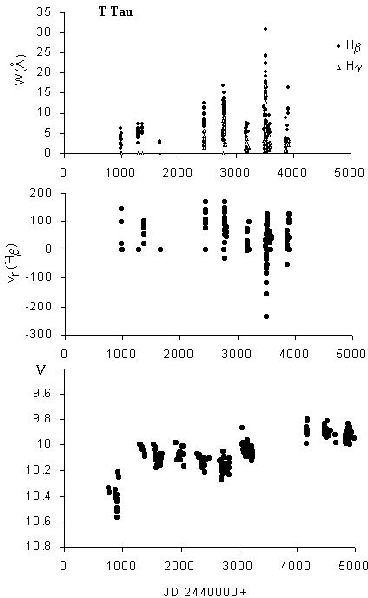
It appears from the figure that the star's ![]() -band brightness was
increasing during the whole time interval and that this brightness
rise occurred in two cycles, each approximately 6 years long
(Ismailov and Samus 2003). The data from Mel'nikov and Grankin
(2005) show the presence, besides the 6-9-year short cycles, also
of a very long, 30-40-year grand cycle of light variations. In
our opinion, the historical light curve shows that the combined
time of the star's brightness increase and decrease is about
60 years, with small cyclic fluctuations some 6 years long.
Currently, the flux from the star is decreasing. The earlier light
increase was accompanied with a 6-year cycle, its amplitude being
about 0
-band brightness was
increasing during the whole time interval and that this brightness
rise occurred in two cycles, each approximately 6 years long
(Ismailov and Samus 2003). The data from Mel'nikov and Grankin
(2005) show the presence, besides the 6-9-year short cycles, also
of a very long, 30-40-year grand cycle of light variations. In
our opinion, the historical light curve shows that the combined
time of the star's brightness increase and decrease is about
60 years, with small cyclic fluctuations some 6 years long.
Currently, the flux from the star is decreasing. The earlier light
increase was accompanied with a 6-year cycle, its amplitude being
about 0![]() 2, and the star was the brightest in 1983. The results
of our spectroscopy demonstrate strong spectral emission during
some cycles, especially when the star is bright. During fainter
stages, the amplitude of variations of the star's spectral
parameters decreases. It should be mentioned that the amplitude of
the brightness variations with the 6-year cycle was 0
2, and the star was the brightest in 1983. The results
of our spectroscopy demonstrate strong spectral emission during
some cycles, especially when the star is bright. During fainter
stages, the amplitude of variations of the star's spectral
parameters decreases. It should be mentioned that the amplitude of
the brightness variations with the 6-year cycle was 0![]() 2 in the
2 in the
![]() band even during the bright state of the star. However, the
variations of the emission-line equivalent widths followed the
star's mean brightness and did not follow the 6-year cycle.
Unfortunately, our spectroscopic data do not permit to verify the
2.8-day period revealed in photometry, better time and spectral
resolution is needed. Nevertheless, our observations make it
possible to claim that the star's spectral activity increased with
its brightness.
band even during the bright state of the star. However, the
variations of the emission-line equivalent widths followed the
star's mean brightness and did not follow the 6-year cycle.
Unfortunately, our spectroscopic data do not permit to verify the
2.8-day period revealed in photometry, better time and spectral
resolution is needed. Nevertheless, our observations make it
possible to claim that the star's spectral activity increased with
its brightness.
3. Conclusions
According to the summary light curve (Mel'nikov and Grankin
2005), the star started to increase its ![]() -band brightness from
the average level of 10
-band brightness from
the average level of 10![]() 6 on JD 2438000, reached a maximum at
9
6 on JD 2438000, reached a maximum at
9![]() 8 on JD 2446000, and then began gradual fading, so that, on
JD 2453000, it became as faint as 10
8 on JD 2446000, and then began gradual fading, so that, on
JD 2453000, it became as faint as 10![]() 2. Figure 1 shows that our
observations mainly cover the time interval of increasing
brightness, when the variation amplitude of the emission-line
parameters also was gradually increasing. The brightness increase
to maximum was 0
2. Figure 1 shows that our
observations mainly cover the time interval of increasing
brightness, when the variation amplitude of the emission-line
parameters also was gradually increasing. The brightness increase
to maximum was 0![]() 8, so that the flux from the star increased
approximately twofold, and the fall from maximum by 0
8, so that the flux from the star increased
approximately twofold, and the fall from maximum by 0![]() 4 is
equivalent to the flux drop by a factor of 1.4. The
hydrogen-emission equivalent widths varied by a factor of two
during the faint state of the star and by a factor of five or
more during the star's bright state. This evidences for the
variability of emission lines and of brightness having the same
source during the faint state. However, additional radiation in
emission lines was observed during the active, bright phase. A
possible additional source can be a hot spot on the star's
surface resulting from disk accretion on the star's surface.
4 is
equivalent to the flux drop by a factor of 1.4. The
hydrogen-emission equivalent widths varied by a factor of two
during the faint state of the star and by a factor of five or
more during the star's bright state. This evidences for the
variability of emission lines and of brightness having the same
source during the faint state. However, additional radiation in
emission lines was observed during the active, bright phase. A
possible additional source can be a hot spot on the star's
surface resulting from disk accretion on the star's surface.
Summarizing we can make the following conclusions.
1. Variability of emission-line equivalent widths by a factor from 2 to 5, respectively during the star's faint and bright states, is observed. The spectral activity of the system differs at different stages of our observations, maybe it is of a long-cycle character.
2. Though the star's light varies with an approximately stable
amplitude of
![]() in the
in the ![]() band during each 6-year
cycle, variations of the emission-spectrum activity occur
independently of the brightness variations during such cycles.
Increased activity of the emission spectrum with increasing
average brightness of the star is observed.
band during each 6-year
cycle, variations of the emission-spectrum activity occur
independently of the brightness variations during such cycles.
Increased activity of the emission spectrum with increasing
average brightness of the star is observed.
3. The total flux variation does not coincide with the variation range for emission-line equivalent widths. This means the existence of an additional source of emission in spectral lines during the bright condition of the star. Such source can be a hot spot formed in the process of disk accretion.
References:
Dyck, H.M., Simon, T., and Zuckermann, B., 1982, Astrophys. J., 255, L103
Guliev, N.Kh., 1991, Kinematika i Fizika Nebesnykh Tel, 7, 51
Guliev, N.Kh., 1994, PZ, 23, 241
Herbig, G.H., 1977, Astrophys. J., 214, 747
Herbst, W., Herbst, D.K., Grossman, E.J., and Weinstein, D., 1994, Astron. J., 108, 1906
Herbst, W., Booth, J.F., Koret, D.L. et al., 1987, Astron. J., 94, 137
Ismailov, N.Z. and Samus, N.N., 2003, IBVS, No. 5382
Ismailov, Z.A., 1972, Astron. Tsirk., No. 734, 6
Ismailov, Z.A., 1973, Astron. Tsirk., No. 763, 5
Ismailov, Z.A. and Rustamov, B.N., 1999, Shamakha Obs. Circular, No. 97, 10
Ismailov, Z.A., 1974, Shamakha Obs. Circular, No. 35, 3
Joy, A.H., 1945, Astrophys. J., 109, 168
Koresko, C.D. 2000, Astrophys. J., 531, L147
Korotin, C.A. and Krasnobabtsev, V.I., 1986, Izv. Krym. Astrofiz. Observ., 75, 166
Loinard, L., Rodrigues, L.F., and Rodrigues, M.I., 2003, Astrophys. J., 587, L47
Mel'nikov, S.Yu. and Grankin, K.N., 2005, Astronomy Letters, 31, 109
Rustamov, B.N., 1999, Shamakha Obs. Circular, No. 97, 14
Solf, J. and Böhm, K.H., 1999, Astrophys. J., 523, 709
Tracy, L.B., Prato, L., and Simon, M., 2001, Astrophys. J., 551, 1031
Zaitseva, G.V., 1978, Astron. Tsirkulyar, No. 984
Zaitseva, G.V., 1978, Astrophysics, 14, 8
Zaitseva, G.V. and Kolotilov, E.A., 1977, Astron. Tsirkulyar, No. 957